|
As I explained in my previous article, I received a specially modified SONY D6C by Doctor Walkman to achieve an extraordinary level of quality. I used it as my reference point and started to do measures, just to learn about the quality that a tape can achieve and the real differences between some walkmans.
I don't want to make extraordinarily exact measures, as I know it maybe requires special (and very expensive) equipment, but enough good measures to fill my curiosity to learn about this.
For the first walkman reviews I released I did test the audio just using my subjective opinion. Although I think I have a very fine ear, I didn't experience real high quality with
tapes in my life, because when I developed my passion for walkmans I was only a teen (without any money, of course) and I only could afford some mid-level walkmans. The most advanced "deck" I have had was the superb AIWA SRD-SR6 Boombox, which has a very high quality sound, but the recording quality was never something I were impressed by.
So, if I want to know the real limits of the tape, I'd have to test and hear an excellent tape recorded in an excellent recorder. And that's why I asked Dr Walkman to build my unique and extraordinary 'super-D6C' that I already explained in another article.
First step, done.
Second step. Now that I already know how good can a superb tape sound, I have to build some sort of tests to discover how good or bad does a walkman sound. The problem is that this task has always been difficult because between experts there's so many discussion about if all the properties of the sound are mesurable. There's no doubt about how to measure the frecuency response or the background noise (although there are different methods to evaluate the last one), but how do we can objectively measure if a walkman sounds "good", "very good" or "warmth"?
Because of that complex problem, and seeing how other people are testing music devices I decided to build my own set of tests, which is composed of:
| - |
A set of objective tests aimed to measure some basic properties of the device: frecuency curve response, wow&flutter and background noise. |
| - |
Listening of a mix of many different songs to get a subjective oppinion about how the bass, voice, highs, spatial sound and other properties of the sound. This test will be driven by playing a tape of extraordinary quality that have to be recorded with excellent quality too. |
Choosing the right equipment
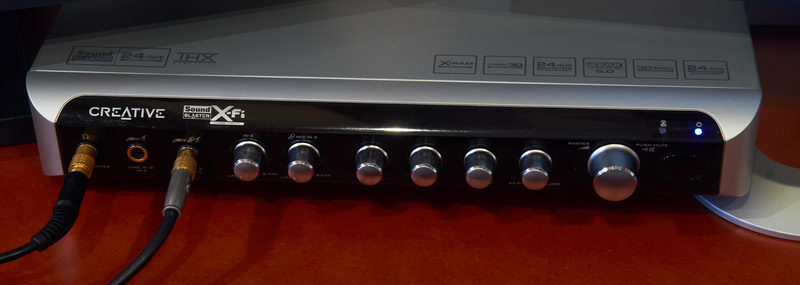
As digital sound is well known for being less imperfect than analog sound, it's a good idea to use it for measuring purposes. The key is to use the aproppiate equipment, and computers are the best equipment. So I tried to do it. For many years I used a good sound card that serves me so good: the Creative Audigy, (first model) with external rack. But I wanted to upgrade to a modern, better card, so I bought the best card that this brand ever released: the X-Fi Elite Pro:
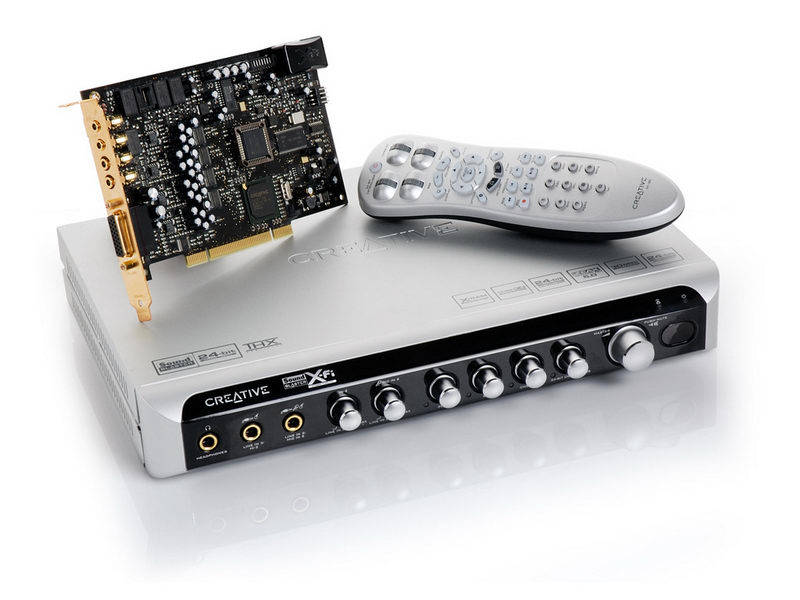
This sound card achieves more than 120 db of dynamic range (the best tape system can be closer to 80 db) so it's way ahead the tape system, and appropiate to measure it. It really sounds awesome, but I like also the warmth of analog sound, and that's why I want to digg in it.
So with this excellent sound card I can drive all the tests, by generating the sound test using some sort of sound analysis software. But also, I can mix the songs using some audio app, generate it in a single file and record to my D6C. This way, it could serve me as a valuable system to measure audio devices, not only walkmans, but also decks, Discmans or MP3 players.
Preparing the objective audio test
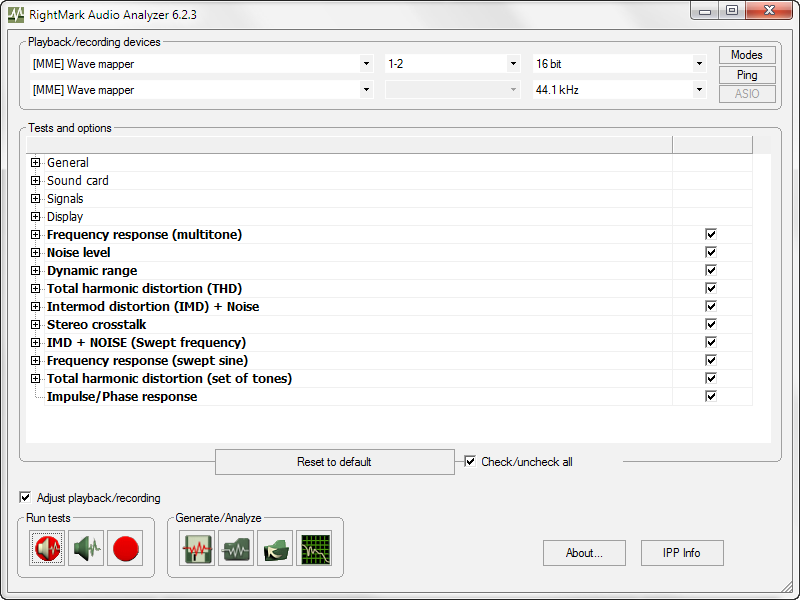
After searching through the web I found and tested TrueRTA analysis software, but I found it not so well suited as RightMark audio analyzer (RMAA), and I decided to use the last one. It's easy to use, quick, it does a complete set of analysis and it's free:
This software is based in the loop test, so for doing the measures I connected both Line-IN and Line-OUT of the D6C to the Line-OUT and line-IN of the sound card, respectively, using high quality cables (that I bought specially for this), to keep the signal as good as I can. the software plays different kind of test sounds through the Line Out while listens on the Line-In. This kind of test has a problem: every single, small problem in both the lines can't be differentiated in the final recording and analysis, because there's no way to know if the problem appeared in one of the other.
That's why using an excellent sound card is a MUST. Only using such a sound card I can drive high quality test. The most important test is the frequency response, because it shows you the entire range that the device can play, and how. If a device has less sensitivity on high frecuencies, then you can see the right zone goes down in the curve.
For doing this frequency test, a special sound is played: a sweep tone, that is: a simple sound with only one frequency that starts in the lower end (a 20 Hz very deep bass tone, the low limit for human ear) and quickly goes to the high end (20.000 Hz, the highest tone the human can hear). If you analyze what sound comes out of a device when playing this, then you can discover the frequency response of it.
And how does it sound? Hear it yourself:
This is a sweep tone that covers the full human spectrum, from 20 to 20.000 Hz.
NOTE: as I don't think the audio quality of this embedded player is outstanding,
you may try downloading it and play on your computer with a good player, like MediaMonkey or iTunes.
What you can hear here is not the pure sound sweep itself, but the way your sound card and your loudspeakers/headphones reproduce it. So if you don't perceive the full spectrum, then it's a problem of your sound system.
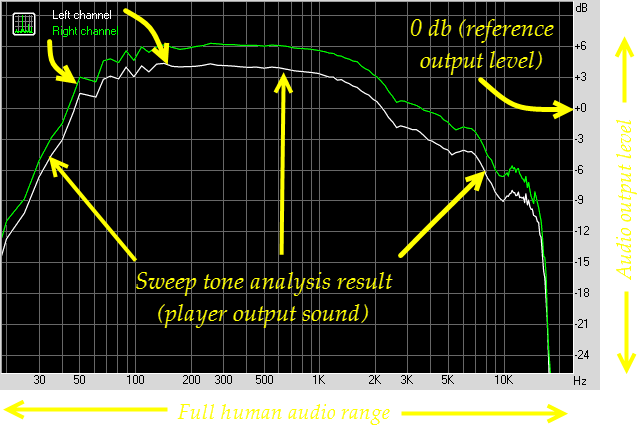
Once the played sound has been analyzed, you can represent it on a graph, so you can see what are the goods and the bads of that device. For you that are not familiar with this kind of graphs, this is how it has to be read: the horizontal axis means the frequency of the sound, and the vertical axis means the volume heard from the device. With the following diagram it will be clearer:
So I tested my old Audigy sound card, and this was the result:
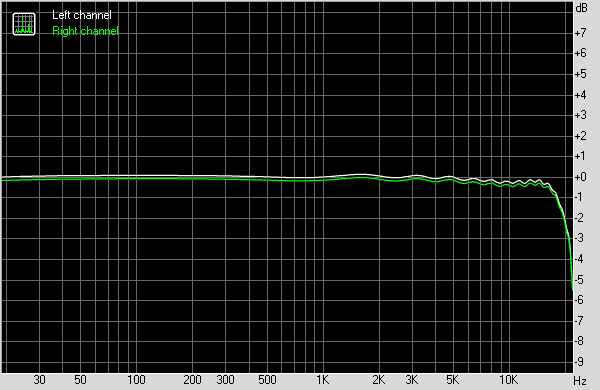
The 1st generation Audigy card delivers very good results: a quite plain freq. response from 20 to almost 20.000 Hz.
However, there are some small irregularities in the high end, and the response at 18.000 and over goes down.
The result is very good, although some small oscillations, a low response over 18.000Hz and a very small deviation between left and right channel can be seen, and I cannot make good measures with them. That's why I decided to upgrade to a new, better card: the X-Fi Elite Pro. Here it is:
So, then I tested the superb X-Fi Pro, and the result was that:
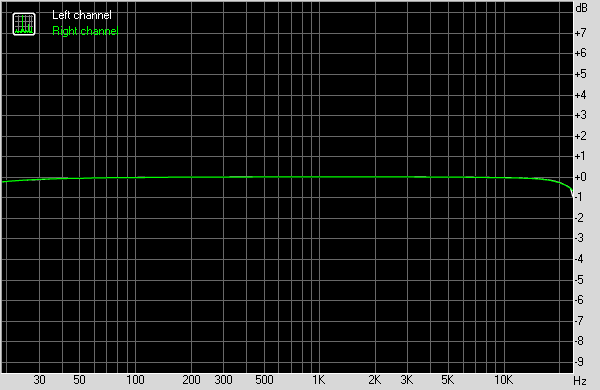
And the resulting curve is almost absolutely perfect. It only shows a -0,3 dB deviation both at 20 Hz and at 20.000 Hz, which are both at the limits of the human hear. Keep in mind that a difference of 10 dB is perceived as double volume of the original, so then you may understand that 0,3dB is almost very close to the limits of the humar ear.
|