|
Preparing the test tape
The first thing I tried to learn is how to adjust the record level on the tape while recording. I know that it has to be as high as it could, but avoiding distortion; this way I can achieve the best dynamic range (DR) and the lowest background noise.
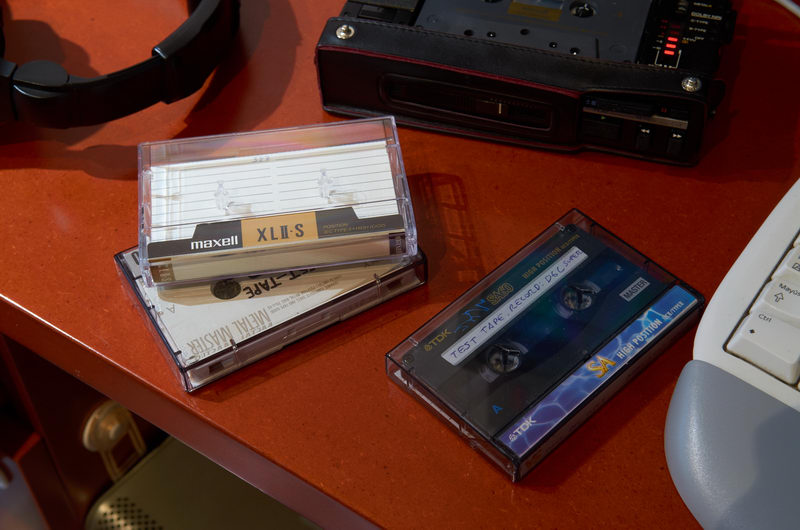
Dr walkman has calibrated my D6C for my usual chrome tape: Maxell XLII-S, which many people say that's an excellent tape, with a very good balance between quality and price. Dr Walkman also suggested me that the TDK SA and UX-Pro are similar and (specially the last one) better, and that he can calibrate for all them (then I started to search for them on eBay so finally I could buy some).
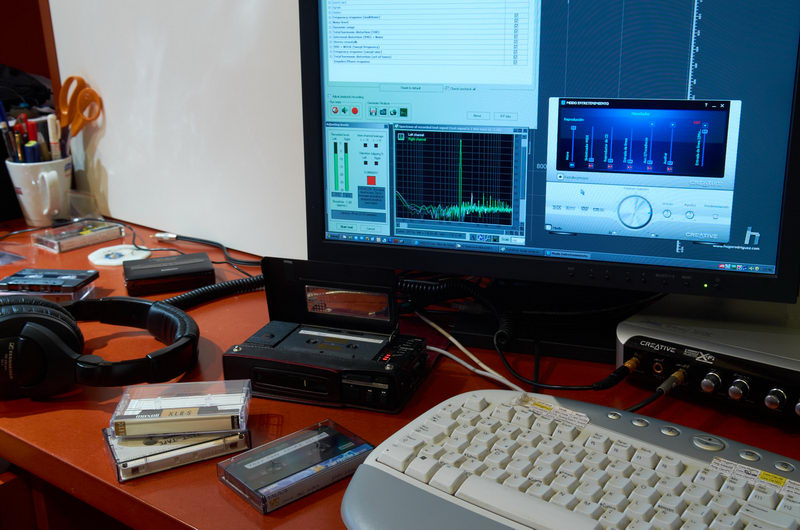
I just wanted to check how much is the UX-Pro better than the Maxell,
so I picked up a Maxell XLII-S clean tape, as I already recorded some tapes on my original D6C and I knew how good does it sound and wanted to know how does it performs actually.
But the first step is to check what's the proper recording level to make the reference tape which will serve as the main test for all walkmans. So I recorded the full RMAA test focusing in the initial calibration signal (1000Hz at -1dB) so it reaches +6, +3 and 0dB in the D6C's VU Meter. After all records were done and all them analyzed, I obtained this result:
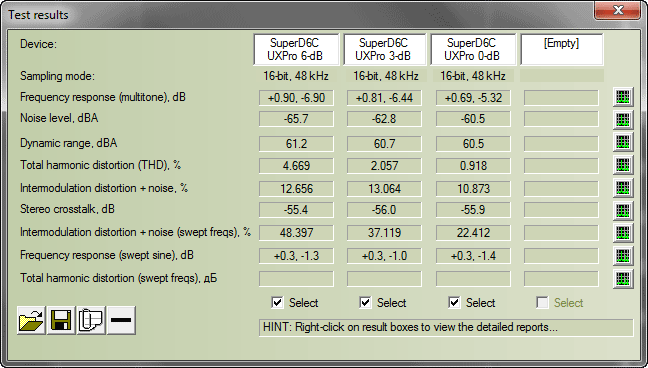
Performance of the UX Pro recorded at 6, 3 and 0dB in the Super D6C.
From this window we can see some interesting data:
| - |
The frequency response (explained some paragraphs below) is quite similar in all them. This confirms that the unit used to record and play has a very plain response curve, so it's a recommendable deck for this task. |
| - |
The noise level (explained some paragraphs below) varies accordingly to the record level. The more the record level, the lower the noise. The reason that explains this is that the noise level remains always the same in the tape, but the signal could go higher, so the difference betweem them has become higher. |
| - |
The Total Harmonic Distortion (THD) has become higher with the recording level. Normally it has to be under 1% for good quality. |
So, for this reason I choose to record at 0dB for making my reference test tape. So I recorded the same test in a brand new Maxell and finally I analyzed both them. This is the result of both:
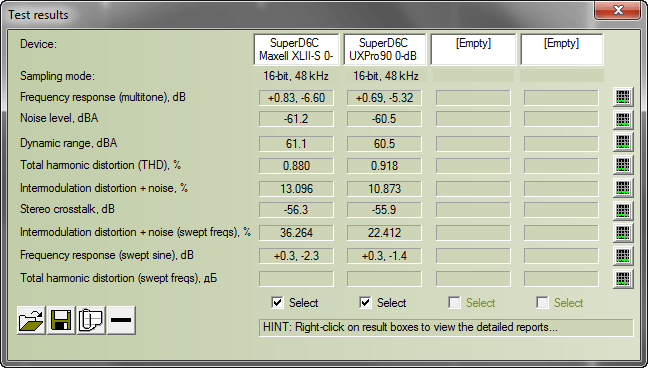
The Maxell XLII-S and SONY UX Pro compared.
In this window there are so many data, but I won't consider all them. For my purposes, I only need the following:
| - |
Frequency response (pink noise), measured in dB |
| - |
Noise level, measured in dBa |
| - |
Stereo crosstalk, in dB |
| - |
Total harmonic distortion (THD), measured in % |
So, how do we know which tape to choose? Well, the main question will be: what does each value means? Not everyone can understand that. I'll try to explain.
Frecuency response curve
The frequency response curve (FRC) is already explained. Here you can see the FR curves of both tapes, recorded and playen in the same D6C:
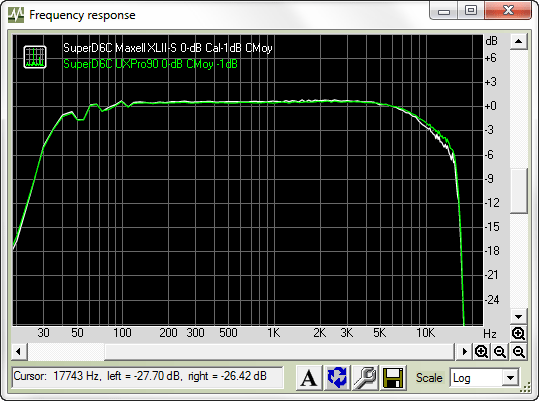
Where the most noticeable difference is that the curve is not so straight as the digital devices shown previously. Well, that's part of the analogic world. These devices are not so "perfect" as modern digital devices, but they have more soul and a warm sound. More on, the more "plain" is the FR of a device doesn't mean that it simply sound better. I have digital players like Discmans of MP3 players and phones and they sound simply awful compared to many tape walkmans. But this is something that we can spent many time discussing and I will write a future article about it.
Apart from that, you can see pretty similar curves, with only a slightly margin in the UX Pro, so I'll choose that tape.
Background noise
Another interesting measure is the background noise level. This measure (expressed in dB) tells us how much noise is there compared to the highest sound achievable WITHOUT distortion. This means that to measure the noise, first we have to adjust all parameters so we can do a record of a sound at the highest level possible on that tape, without distorting it. Then, we simply play a segment of the tape where we don't have anything recorded, so we can measure the noise. The lower the noise, the better the device. Measuring the volume difference (in dB) between the recorded sound and the noise we can get a precise idea of how good that walkman+tape performs. This noise measure is almost the same that the dynamic range.
For this purpose I record putting an eye on the VU meter of the D6C and adjust the record level so it reachs 0dB but not +3dB. This can be easily done with this great recorder.
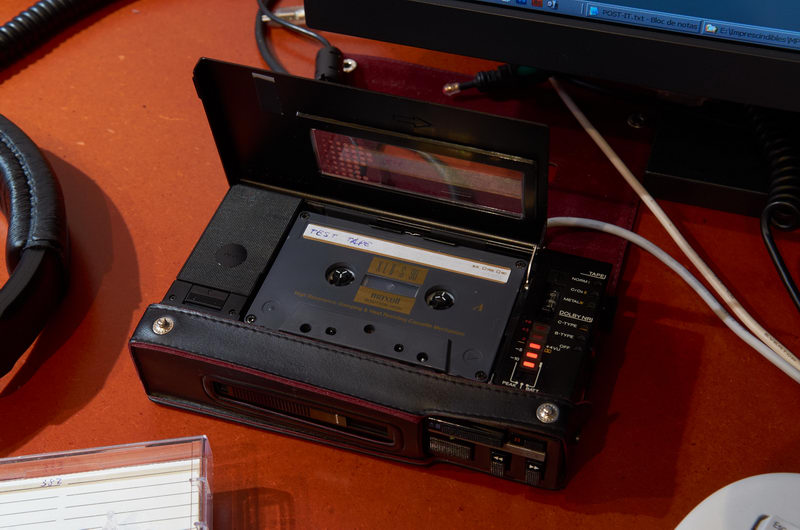
This measure is very important for music that has low volume or very few instruments, because when there are so many, noise is barely perceived (like with live rock music). This is the background noise of the D6C:
And this is the same noise, amplified 30dB:
As you see in the main result window, I can achieve about -60dB of noise with this tape, whithout using dolby at all, which is a pretty good value:
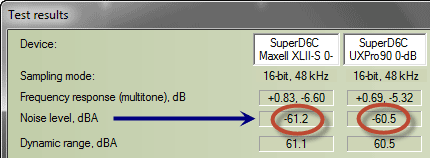
60dB under 0 reference level is one of the best values you can achieve with a good deck. Better values can be reach using Dolby systems.
Using TrueRTA analysis software it's possible to make a better analysis, so I can see how the background noise actually is:
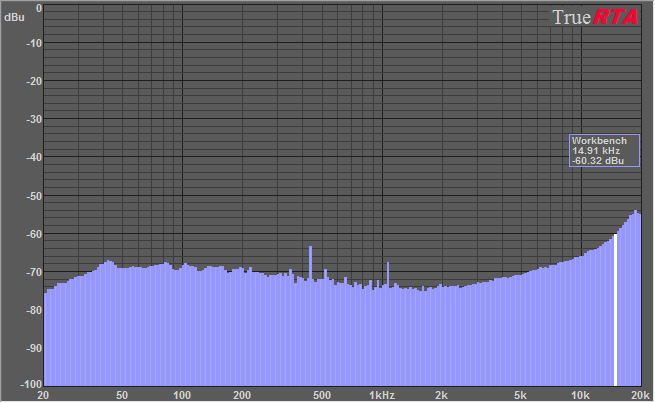
Background noise of the Sony D6C. The volume level at 15kHz indicates the noise level.
We can see here that it's -60.32dB, almost the same value of -60.5dB that RMAA showed.
And here you can see the real difference in the background noise between using Dolby B, Dolby C and no reduction at all:
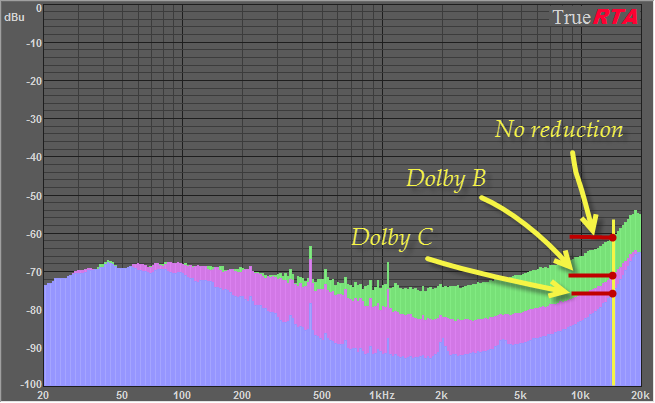
Background noise of the Sony D6C. The volume level at 15kHz indicates the noise level.
For reference, this is the background noise of the D6C using Dolby B (a precise real recording, so you can have an idea of how really is):
And this one, with dolby C (again, a precision recording with real noise level):
However, using Dolby usually makes the sound dull, because it often cuts so much the high frecuencies. So another interesting measure will be how a player does it perform using Dolby.
Stereo crosstalk
This value measures the separation between both channels (right and left). The better the amplifier and the whole circuitry, the lower the crosstalk, which leads in a better separation of both channels. This can be specially felt when listening to music with spazialization, like live recordings.
Wow&Flutter
One of the most important things to check in a tape player is, apart from previous stuff, the wow and flutter, which the audible oscillation of playing speed both at very low frecuency (wow, about 4Hz) and reasonably high frecuency (flutter, about 200Hz).
This measurement is often calculated in various standards, while DIN is one of the most common, and the one I choosed for my tests.
For measuring it I recorded and 3kHz signal with my modded 'superD6C', which has very low wow&flutter. Then I play the tape on the walkman to be measured while recording it to a mono, uncompressed (PCM WAV) file and load it in the wow&flutter measuring software (thanks to stereo2go's intell2000 user):
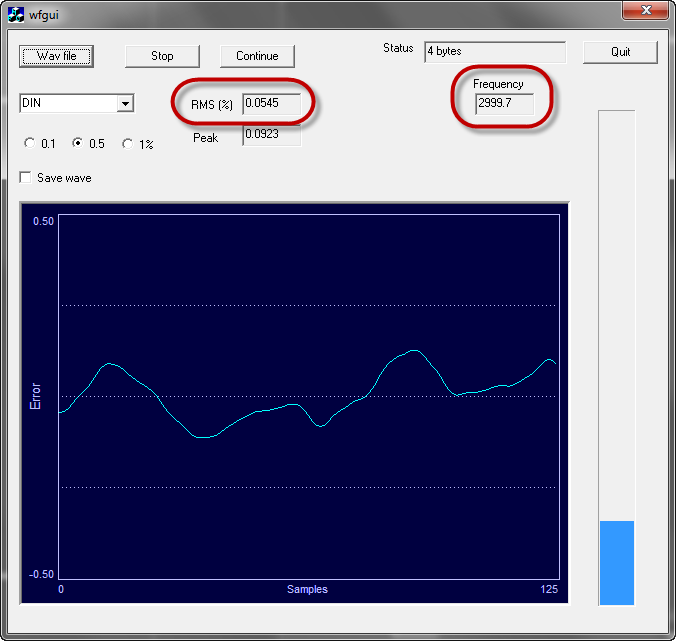
The wow&flutter measurement on my modded 'Super D6C' shows an surprinsingly low value of only 0,05%,
which is almost better than many high-end decks. This software also shows the average frecuency measured,
which in this case is 2999.7 Hz, almost the same 3000Hz recorded.
Just to confirm, let's see how the budget SONY B39 performs:
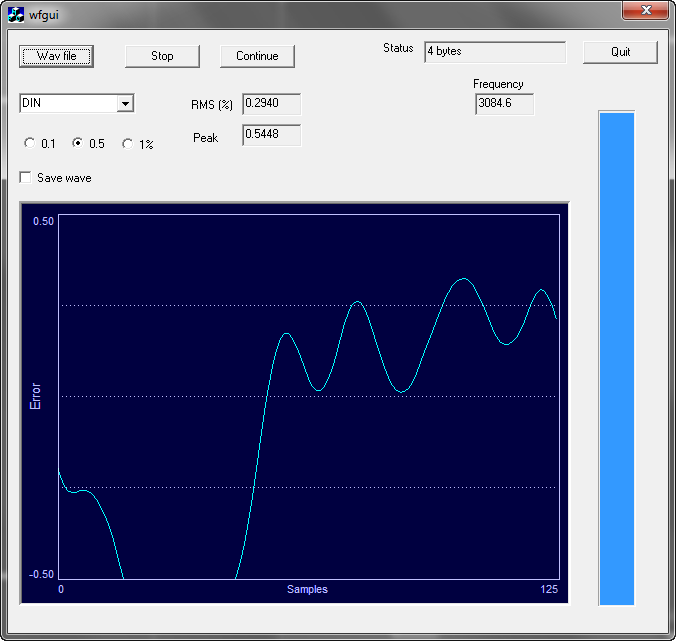
The
SONY B39, that doesn't have any advanced transport system (like the quartz-locked disc drive of the D6C)
shows a value of 0,29%, which is normal for such a mid-level walkman.
As you can see the 'Super D6C' has about 0,05% of w&f while the B39, almost 0,30%, which is 5 times more. That's a lot, indeed.
But... how does it feel? what's the real difference between an excellent and a poor wow&flutter? Let's see real examples:
This is a real example of a plain high tone (3000 Hz to be exact) carefully recorded on an excellent tape (SONY UX Pro, last generation) played on a Panasonic RQ-P525, a high-class walkman (which features Dolby C). This walkman has a high w&f, worsened by some kind of problem in the roller:
and this one is the same tape played on a SONY TC-D5 Pro, one of the best portable machines ever built, very close to the superb D6C, and even better in some aspects. This state-of-the-art portable player has a w&f of only 0,037% (even less than my 'Super D6C'!):
As you can hear, the difference is huge.
Subjective audio measurement
The second part of my audio analysis has to be non-technical. After reading some reviews in very respectable websites, like Innerfidelity, I decided that I'll perform a mixed set of test: both technical (objective) and the next one, completely subjective. I've often read by reviewers that they don't have a fixed set of songs to test always the same way, but a few songs here and there.
But I wanted something more serious, so I started a few months ago to slowly select songs I like that have something interesting that allows me to extract anything interesting from a player.
So I made a 12-minute mix specially done to allow a wide variety of styles to test any music device. From classical to hard rock, through disco, '80s pop, vocal, live or electronic. From Chaikovsky to AC/DC, through Eric Clapton, Celine Dion, Chris Cornell or U2.
The mix is made to allow testing of:
- Dynamic range
- Soundstage,
- Many kinds of bass, through those found in Blues to electronic or disco
- Voice, both isolated (man and woman), smooth, broken, etc...
- Guitar (acoustic, electric, heavily distorted...)
- Surround effects (like in 'Black or white' from Michael Jackson)
- Live recordings (U2, AC/DC)
Here it is the song list, sorted in order of appearance:
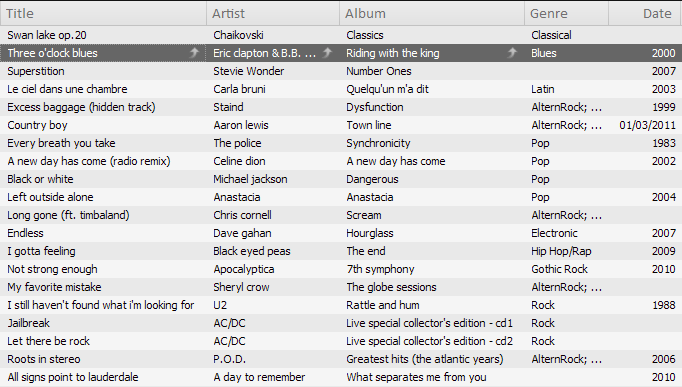
To make this mix, I selected carefully every song from a big list, then I extracted them from CD (without compression) or downloaded (at with very high bitrate or lossless) and mixed in a professional-grade software, then exported in a WAV file (no compression at all).
All them were normalized to the same level. Here it is:
So this is a true wide style music style that allows a thorough test of the audio response of a music player in too many different scenarios.
You can download it, experiment with it as much as you want.
NOTE: I detected heavy audio processing in
this Soundcloud files. Looks that they apply some kind of loudness or dynamic compression to the audio. If you really want to hear the real file, please download it.
For testing walkmans, I recorded this mix on a UX Pro using my 'Super D6C' toghether with the rest of objective test, so I can quickly review a player.
Performing a real analysis
So finally, to measure a Walkman, I proceed like this:
| 1) |
Take the walkman to a professional repairing service. For the common faults (belts, dead capacitors) I take them to a professional (official) SONY and AIWA technician here in Barcelona. This man has been working as an external technicial for both SONY and AIWA for 30 years. |
| 2) |
Put the reference tape on it. The first step is -if it's possible- to adjust the Azimuth following precise intructions from Dr Walkman. |
| 3) |
Then I adjust the maximum output level to 0dB in the line input of the sound card and check that it doesn't suffer from clipping. I do this using a 1kHz sine signal. |
| 4) |
Once adjusted the output level properly, I play and record a 3kHz signal for 15" to measure wow&flutter. |
| 5) |
Play the full RMAA audio test, to measure all its characteristics. |
| 6) |
Measure the frequency response curve (FRC) using pink noise recorded on a SONY UX Pro tape and TrueRTA analysis software. The measure is done at +3, 0, -10 and -20 dB. |
| 7) |
Measure the FRC with and without dolby systems. |
| 8) |
If the player has a built-in EQ, measure the FRC of every slider of the EQ set to maximum value. |
| 9) |
Measure the background noise with and without Dolby in TrueRTA analysis software. |
| 10) |
Play the subjective 12-minute mix to get a subjective impression of how it sounds. |
And that's all!
Want to know how do I put all this info in a particular walkman review? Continue to this article to see it.
|
![]()
![]()
![]()
