|
Performance
This is the first time I test a tape and I want to do things right. I’ve contacted Wilhelm, a well-known expert that worked as a chemical engineer at BASF back in those days and he was very kind to help me.
To analyze this new tape I want to find out:
- The optimal bias setting.
- The frequency response both at bias optimal setting and at default (zero) setting.
- The THD (Total Harmonic Distortion) at both bias settings.
- The background hiss.
To test all that I needed new tools, especially for the THD, so I’ve searched and found a software that looked fine to me: DSSF3, by Yoshimasa Electronic Inc. This nice piece of software looks easy to use and has all the tools I need for testing: frequency response (both with sweep and pink noise), THD and many things more. I’ve contacted them and they were kind enough to give me a free license for using in this my non-profit website.
I’ve used my SONY TC-K909ES restored and upgraded in 2016 that is in perfect performance. The sound card is a Creative X-Fi Elite Pro (24/96).
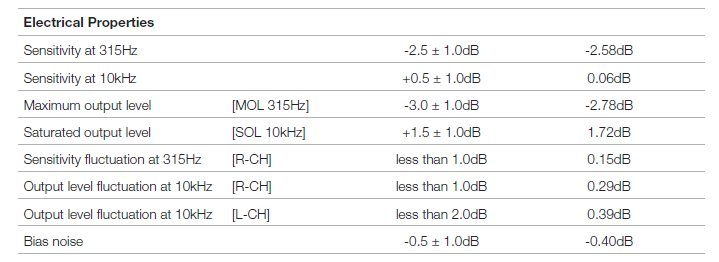
I’ve asked the people at NAC to send any technical data sheet that they have for this tape and they sent me a PDF with some interesting (and strange) data. First of all, we see that the tape is actually made by Saehan Media, a company from South Korea. Guess what? These guys made the very first MP3 player in the history: the MPMan.
We also can see that the sensitivities of the tape are compared to those of the IEC II reference tape, but... why?

If this is a type I tape the reference values should be compared to those for type II. Why are they doing that? Is that because this tape is supposed to perform as good as a type II tape? I don't know...

Then if we look at the specs we see that the MOL is only -2.78 dB, which is quite low, even for a type I tape. The sensitivity for 315Hz (which is meant to voice) is also low (-2.58 dB) but surprisingly is high for high frequency (0.5 dB at 10kHz). And the SOL is quite high (+1.72dB). So it seems that it’s a tape that has quite strong high frequency response. Let’s check it out.
The first thing to do is to find the optimal bias point. This is usually found recording two tones that let us know where is the MOL and SOL best setting. To show you an easy to understand picture, I turned on the assisted calibration system of the K909ES and photographied the very deck's knobs and display. And this is the result:
As you can see, the sensitivity is very low, because the output is very low at almost any bias setting. It is so low that I had to push the REC LEVEL CAL knob (Rec Cal) to the maximum so the reading could be seen in the deck’s screen.
Now let's see this in the real time audio analyzer. For this I used DSSF3 and two tones. I was thinking in using the very same tones that the K909ES generates itself but as they cannot be heard externally, I opted to use my AIWA XK-S9000 own generator that can be heard. So I adjusted them to -20dB (under Dolby mark) in the K909ES and I was ready to go.
After this I’ve measured the values using DSSF3, putting both tones at exactly -20dB (under Dolby level) and I got this:
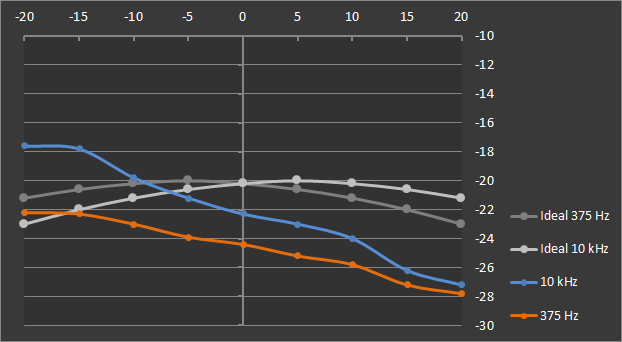
If I plot all these values in a graph, being the horizontal axis the bias setting (going from -20 to +20) and the vertical axis being the dB, the result is this:

Here are the results for both the tones in red and blue.
Just as a reference I added where the ideal curves should look-like, in grey.
This graph helps to figure out where the best bias setting is (which I’ll call optimal bias). The optimal bias is the one that gets the highest output and also lowest distortion out of the tape. This setting makes the tape perform at its best. The only problem is that this setting doesn’t always give the flattest response. This is why some high end decks have a Rec EQ knob, which helps getting a flat response from the very low to the highest frequencies.
|
![]()
![]()
![]()
